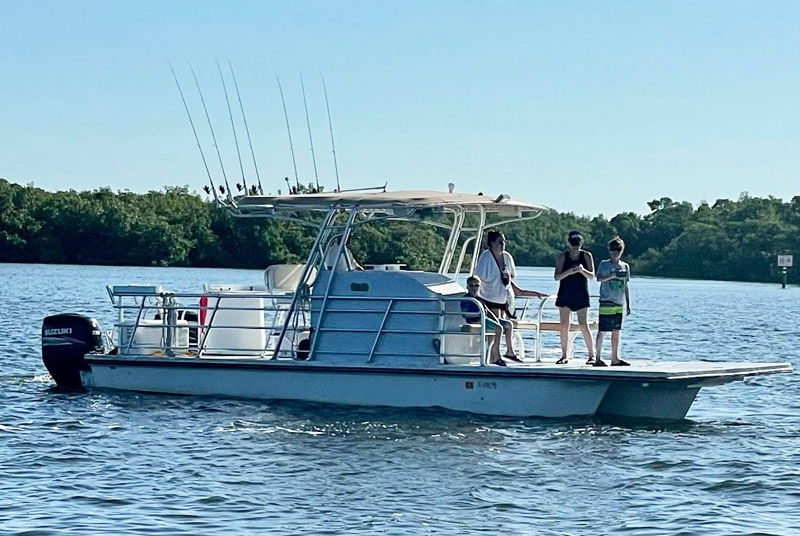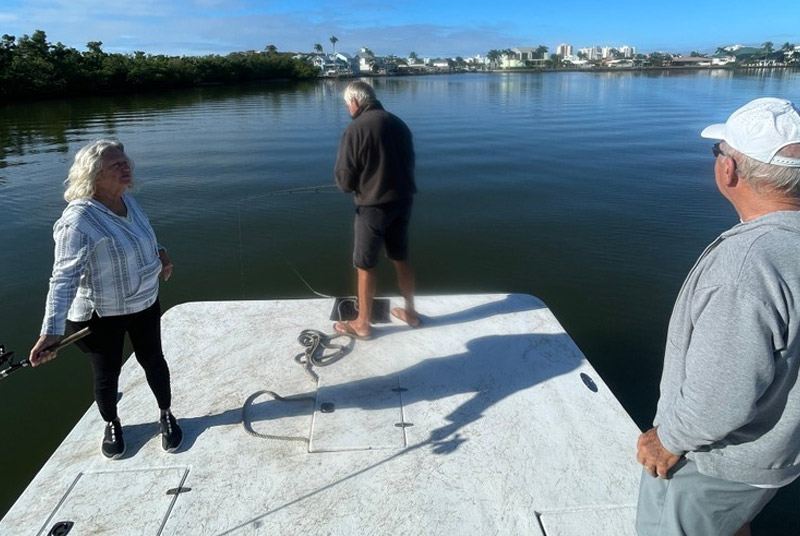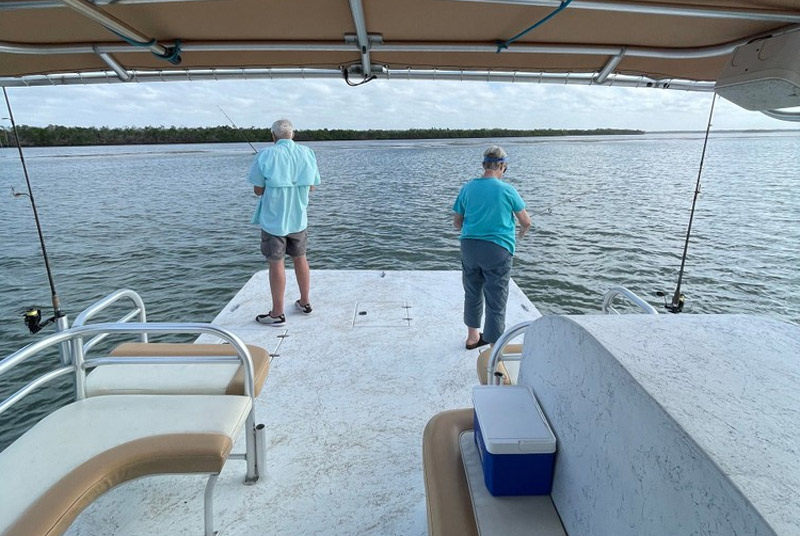
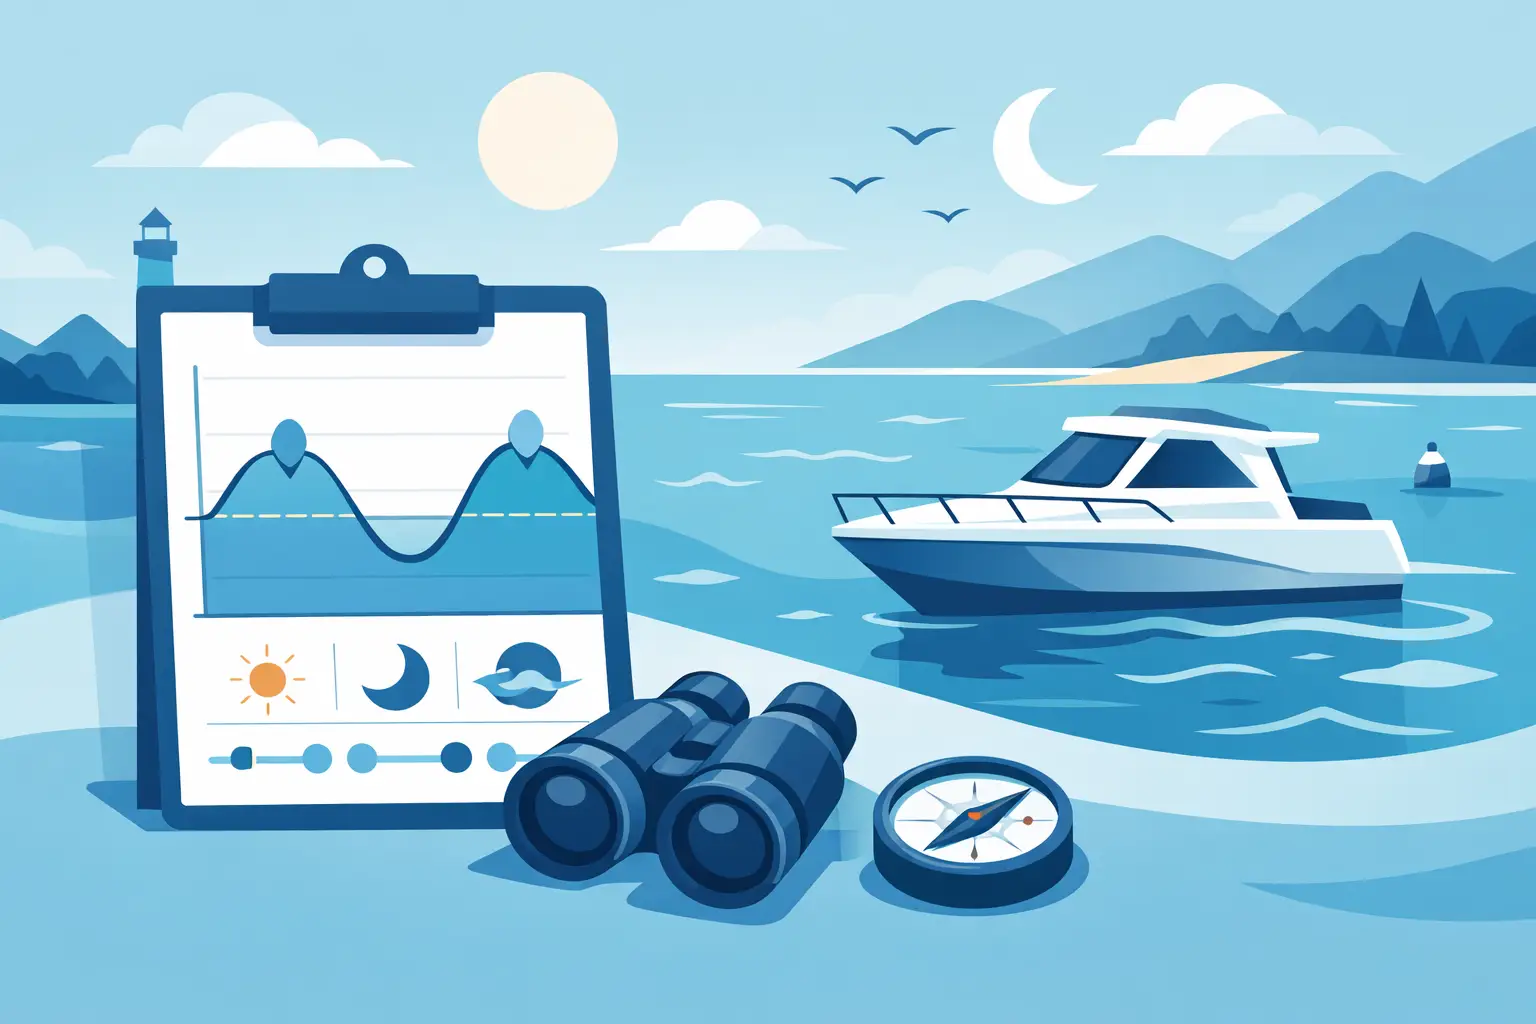
A tide chart can tell you whether a sandbar will be a shelling jackpot, a shallow pass will be comfortably navigable, or your “quick beach stop” requires a much longer walk through ankle-deep water. That is why learning how to read tide charts is one of the most useful little skills for a day around Fort Myers Beach. You do not need to become a marine scientist before breakfast. You just need to know what the numbers, curves, and times are trying to tell you.
For boaters, anglers, paddlers, shellers, and families planning time along the shore, tides affect far more than the view. They influence water depth, current strength, wildlife movement, beach access, and how much room there is to spread out your towel without the Gulf reclaiming the real estate.
How to Read Tide Charts: Start With the Basics
A tide chart is a forecast of changing water levels at a specific location. It shows when high tide and low tide are expected, along with the predicted height of the water at those times. Most charts display a wavy line across the day, while others use a simple table of times and heights.
The high points of the curve are high tides. The low points are low tides. The rising portion is called a flood tide, and the falling portion is called an ebb tide. Those names sound technical, but the practical meaning is simple: flood tide means water is coming in; ebb tide means water is heading out.
Always check that the station on the chart is close to where you will actually be. A prediction for a nearby inlet or harbor may not match a beach, mangrove creek, back bay, or pass exactly. In Southwest Florida, even a short distance can change the timing and strength of the current, especially around narrow channels and barrier islands.
Read the Time Before the Height
Each high and low tide will have a time beside it. That tells you when the water will be at its highest or lowest predicted point, not when it begins changing. Water is moving throughout the cycle.
For example, if low tide is listed at 10:30 a.m., the water has been falling for hours before that time and will start rising after it. If you want to explore exposed sandbars or look for shells along the low-tide line, arriving exactly at low tide is often fine, but arriving an hour or two before can give you more time to enjoy the changing shoreline.
Be careful with the time zone and daylight saving setting in any app or printed chart. A chart that is off by one hour can make a meaningful difference when you are planning a launch, a beach walk, or a return through shallow water.
What Tide Heights Actually Mean
The number beside a tide time is the predicted water level, commonly shown in feet. A high tide of 2.4 feet is higher than a high tide of 1.5 feet. A low tide of -0.3 feet is lower than a low tide of 0.8 feet.
That negative number does not mean the water has vanished. It means the predicted level falls below the chart’s reference point, called the chart datum. Think of chart datum as a very low baseline used for navigation. A negative low tide can expose more shoreline, make shallow flats extra skinny, and reveal sandbars that are normally hidden.
The difference between a high tide and the following low tide is the tidal range. A larger range generally means more noticeable changes in water depth and a stronger potential for current in constricted areas. A small range means the water level changes less dramatically, though current can still be surprisingly lively in a pass.
The Curve Tells a Better Story Than One Number
A tide chart is most useful when you look at the whole day rather than circling one high or low tide. Notice how steeply the line rises or falls. A steeper section usually signals water level changing more quickly. In narrow channels, that movement can translate into stronger current.
Slack tide is the short period near high or low tide when the water’s movement may slow before changing direction. It is not always perfectly still, and local wind or geography can keep water moving, but it is a helpful concept. Paddlers often appreciate slack periods near tight passes, while anglers may target moving water because baitfish and predator fish frequently respond to current.
On much of Florida’s Gulf Coast, you will usually see two high tides and two low tides in a day, but they may not be equal in height. That is normal. One low may uncover a lot more beach than the other, and one incoming tide may bring more water through a particular channel than its counterpart.
Tides, Currents, and Wind Are Not the Same Thing
This is where a little local knowledge pays off. A tide chart predicts water level. It does not give you the full picture of conditions on the water.
Current is the horizontal movement of water. Tides help create it, particularly around passes, inlets, and channels, but currents are shaped by local geography. Wind can push water toward shore, pull it away, create chop, or make a normally easy outing feel sporty. Offshore wind may make the beach look inviting while lowering water levels in shallow bays. Strong onshore wind can pile water up along the coast and make a predicted high tide higher than expected.
Weather systems matter too. A chart is based on astronomical predictions, not a promise from Mother Nature. Low atmospheric pressure, persistent wind, storms, and seasonal conditions can shift actual water levels. Treat the chart as a smart planning tool, then check the weather, observe the water, and use sound judgment once you arrive.
Use the Tide for the Activity You Have Planned
The “best” tide depends on what you want to do. There is no single perfect answer, which is good news for anyone who likes a flexible vacation schedule.
For shelling, lower water often reveals more shell-rich shoreline and makes it easier to walk areas that are usually submerged. The first part of an incoming tide can also be interesting, since fresh shells may be moved toward shore. Wind direction, recent wave action, and the particular beach matter just as much as the tide, so low tide is a strong clue, not a guaranteed treasure chest.
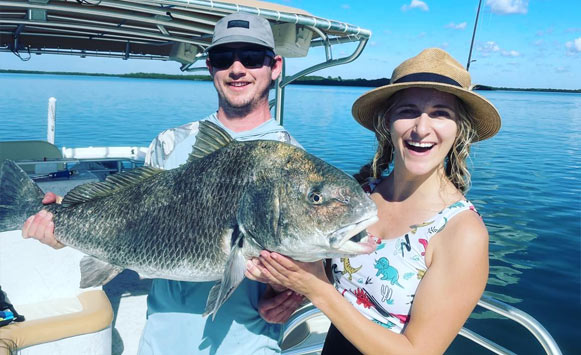
For fishing, moving water is frequently productive. Current carries bait, and game fish often position themselves where they can feed efficiently. The best stage can vary by species, spot, water temperature, and whether you are fishing a grass flat, mangrove edge, bridge, or pass. An experienced captain watches the tide, but also watches the birds, bait, water clarity, and the day’s conditions.
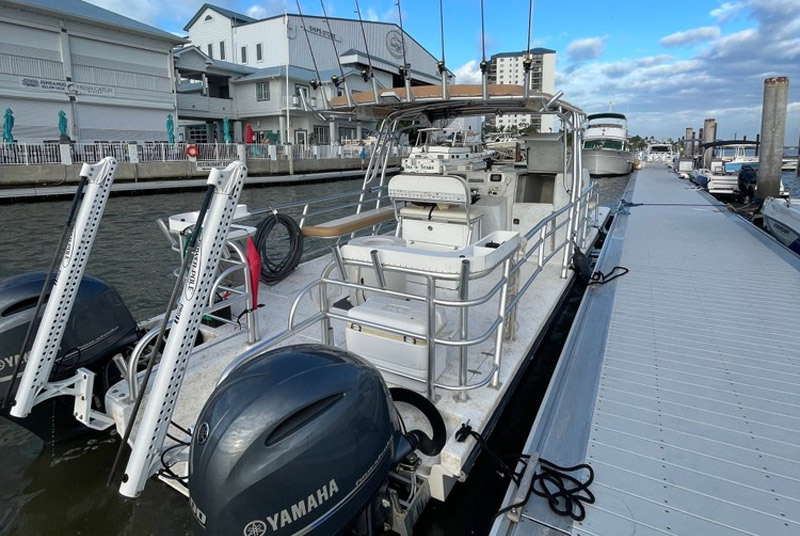
For boating, tide height is especially valuable in shallow backwaters. A route that is easy at a higher tide may become very shallow on a low one. Give yourself more margin than the chart suggests, particularly if you do not know the area. Sand shifts, boat wake, wind, and an incorrect assumption about your draft can turn a relaxing cruise into an unplanned lesson in patience.
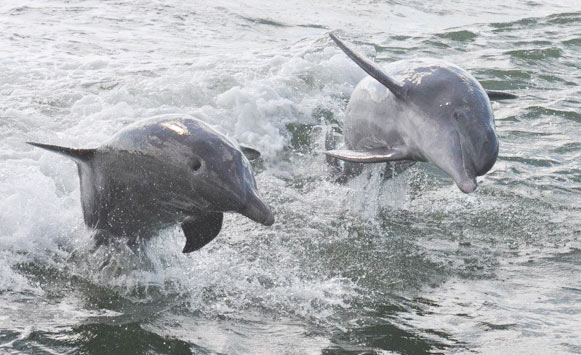
For wildlife viewing, tides can shape where animals feed. Wading birds may work exposed flats and shorelines as water recedes. Dolphins often travel and feed around passes, channels, and bait concentrations, though they do not punch a time clock based on an app. Manatees, shorebirds, and fish respond to a broader mix of tide, temperature, food, and season.
A Simple Way to Plan Around a Tide Chart
Start by choosing your location and date. Look at the high and low tide times, then note the heights. Next, consider the activity: do you need water to access a channel, or do you want exposed shoreline for a beach walk?
Then add the real-world variables. Check wind, storms, boat traffic, and your group’s comfort level. Families with young children may prefer a calmer, more relaxed window over chasing the absolute lowest tide. A first-time kayaker should not plan a long crossing through a fast-moving pass just because the chart looks interesting.
If you are heading out on a guided cruise or private fishing trip, share what you hope to experience. A knowledgeable local crew can match the day’s conditions to the route, from calm protected waters to productive fishing areas and wildlife-rich shorelines. Good Time Charters’ naturalist-led outings are built around that same principle: the water is always changing, and paying attention is part of the fun.
Common Tide Chart Mistakes to Avoid
The most common mistake is treating the posted high or low time as the only time that matters. Tides are a cycle, so plan for the hours leading up to and following the peak.
Another is assuming a tide prediction includes wind and weather. It does not. If conditions look different than expected, trust what you see and adjust your plan.
Finally, avoid assuming that a chart for one place applies everywhere nearby. Local waters have personality. A quiet mangrove creek, an open beach, and a busy pass can react very differently to the same tidal cycle.
The best tide chart habit is wonderfully simple: check it before you go, then look up once you get there. Watch the water moving over the flats, notice where the birds are feeding, and let the coast show you what the numbers mean. That is when a planned outing starts feeling like a real Southwest Florida adventure.